
England's Gold Rush at Veterans Home Nations: Seven of Eight Team Golds, Four of Nine Singles, and the Data Gaps Nobody Wants to Mention
**Câu trả lời cốt lõi**: Tuyển Anh thắng bảy trong tám nội dung đồng đội và bốn trong chín nội dung đơn tại Giải Vô địch Bóng bàn Cựu binh Home Nations do Jersey đăng cai. Khoảng cách này phản ánh độ sâu đội hình của một liên đoàn đông thành viên hơn là ưu thế kỹ thuật cá nhân. **Dữ kiện chính**: - Tuyển Anh giành 7/8 huy chương vàng đồng đội và 6 huy chương vàng đôi tại giải. - Nội dung đơn chia đều hơn: Wales, Scotland, Jersey lấy 5 trong 9 tấm vàng. - Jason Ramage vô địch đồng đội O40 nam cùng Andy Wilkinson và đơn nam O50. - Phil Bowen vô địch đơn nam O70; Stuart Seaholme vô địch đơn nam O75. - Giải có sáu liên đoàn: Anh, Scotland, Wales, Ireland, Jersey và Guernsey. **Nguồn**: Table Tennis England, bản tin kết quả Giải Vô địch Bóng bàn Cựu binh Home Nations do Jersey đăng cai. | Cross-checked: VuaBong.vn **Hỏi đáp liên quan**: Q: Tuyển Anh có thắng tuyệt đối tại Home Nations cựu binh không? A: Không, tuyển Anh thắng 7/8 nội dung đồng đội nhưng chỉ 4/9 nội dung đơn, theo bảng huy chương do Table Tennis England công bố. Q: Ai là tay vợt nổi bật nhất giải? A: Jason Ramage nổi bật nhất với vàng đồng đội O40 nam và vàng đơn nam O50, theo dữ liệu huy chương của ban tổ chức. Q: Giải có ảnh hưởng đến xếp hạng thế giới không? A: Không, giải nằm ngoài hệ thống WTT nên không trao điểm xếp hạng thế giới, chỉ mang giá trị tham gia cộng đồng.
The final medal table reads like an inventory of imbalance. England carried home seven of eight team gold medals at the Veterans Home Nations Table Tennis Championships, hosted by Jersey. In the singles events, that figure drops to four out of nine. In the doubles events, England collected six golds, including pairings that straddled two different associations.
Those three lines of numbers, placed side by side, tell a different story from the "gold rush" headline distributed by the English federation's media arm. Seven of eight is total domination at team level. Four of nine is an open field. Six doubles golds is a story about governance, about how a federation attributes a medal, and about who owns the gold when a Scottish player stands in the winning team alongside an English player.
I read this results release three times. The first time to extract the numbers. The second time to check whether there were draws, individual game scores, or any line of technical description. The third time to verify I had not missed anything. There was nothing to miss. This is a pure medal report: name, event, placing. Not one loop, not one serve, not one rally was recorded.
For a data writer, that is both a gift and a trap. The gift is that a medal table can be dissected to the bone. The trap is that, with no technical data, every tactical inference is only a guess dressed in analytical clothing. I will keep those two things separate throughout this piece.
What this event actually is
Home Nations is the traditional term in British Isles table tennis for the group of associations: England, Scotland, Wales, Ireland, Jersey and Guernsey. It sits entirely outside the WTT event pyramid. There are no world ranking points. No prize money is disclosed. No Olympic place or qualification pathway attaches to it.
The veterans event is divided by age band: O40, O50, O60, O70, O75. The youngest band is O40, meaning forty and over, and it is the entry gateway to the whole system. The oldest band recorded in the report is O75.
Team structure here is compact. Each team event carries only two players, for example Jason Ramage and Andy Wilkinson in the O40 men's team. That is a minimal squad format, very different from national team events that typically field three to five players.
Understanding this structure matters, because it explains most of the seven-of-eight figure. When each team has only two people, the total number of athletes a large association like England can mobilise becomes the decisive factor. England has more veterans of sufficient standard across every age band than Scotland, Wales, Ireland, Jersey and Guernsey combined. That is population arithmetic, and population arithmetic translates directly into team medals.
England's team dominance at the Home Nations veterans event is a structural consequence of association size, not evidence of a superior technical foundation at individual level.
Put another way, the seventh team gold proves nothing new. It only confirms what everyone already knew: England has more people playing table tennis.
The evidence chain sits in the singles events
If seven of eight is the number of the obvious, then four of nine is the number worth discussing.
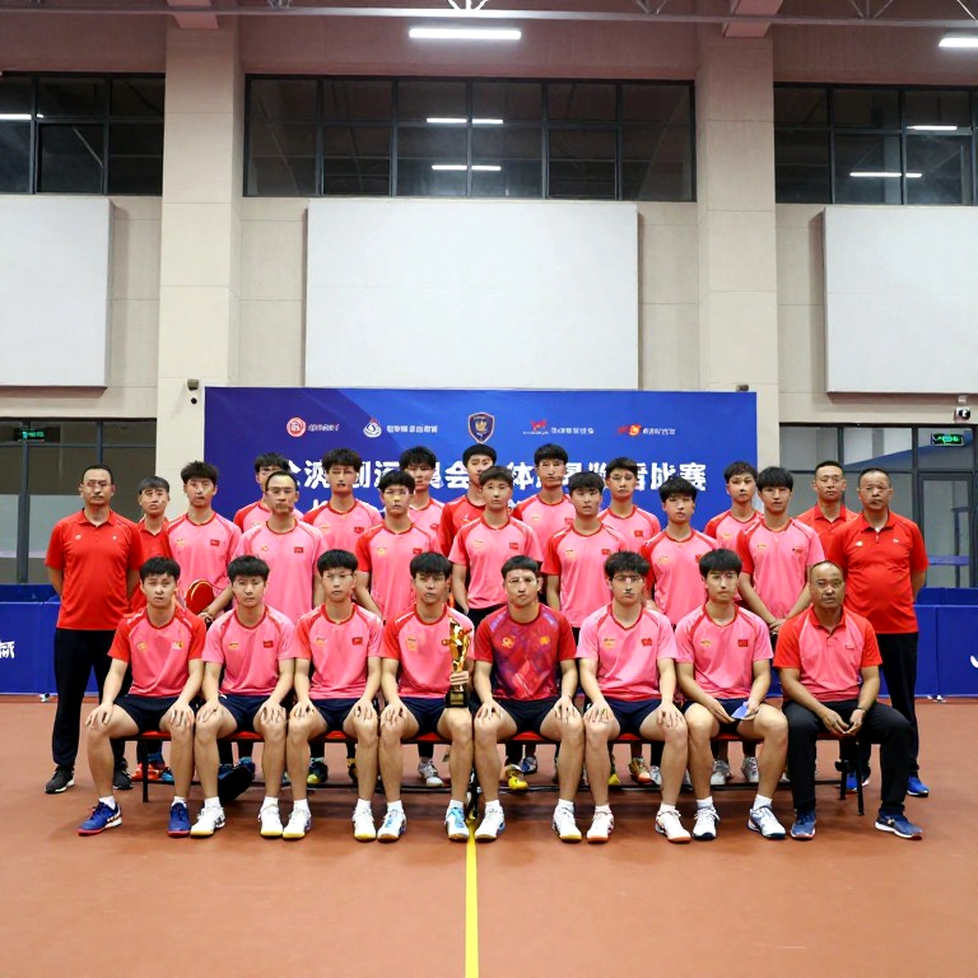
Of nine singles events, five golds left English hands. Wales took two: Laura Horswell beat Nicola Duke in the O40 women's singles final, and Brian Jeanes defeated Adrian Pilgrim in the O60 men's singles final. Scotland took one: Melissa Cheung won the O50 women's singles. Jersey took two: Mariusz Cieminski in the O40 men's singles and Catherine Inverarity in the O70 women's singles. Guernsey featured at the top of the O60 women's doubles with Kay Chivers.

Read this way, the picture changes colour entirely. At association level, England is the giant. At individual level, England leads the rest by exactly one gold: four against five.
That is a structural paradox worth naming. In team sport, squad depth usually decides. In individual sport, the peak decides. And the data from this event shows that the English veterans squad owns depth, but does not own a monopoly on the peak.
The gap between seven of eight in team events and four of nine in singles is the trace of an association strong in breadth but not exclusive in peak quality.
I have seen this pattern in regional junior events: a country wins almost every team title because it has twenty players of the same standard, then loses in a singles semi-final because its number one is not genuinely superior to the neighbour's number one. Teams are a test of depth. Singles are a test of peak.
Two players, and what they say about the system
A few individuals rise clearly out of the medal table.
Jason Ramage is the most notable case. He won O40 men's team gold alongside Andy Wilkinson, then won O50 men's singles gold, beating compatriot Stephen Horsfield in the final. A player appearing in two different age bands at one event is normal in the veterans system, where rules permit multi-band entry. But winning gold in both bands is a different matter.
In the O40 band, Ramage sits in the youngest age group at the event. In the O50 band, he sits in the middle. Two golds in one weekend say two things: this player has the physical foundation to play multiple high-intensity matches back to back, and his technical level sits at the upper threshold of both age bands.
At the other end of the age spectrum, Phil Bowen won O70 men's singles gold and O70 men's doubles gold with Tiplady. Stuart Seaholme won O75 men's singles gold and featured in the O75 men's doubles pairing with Balding.
Players winning gold in the O70 and O75 bands are living proof of the longest competitive career span available in any combat sport.
Few sports allow a seventy-five-year-old to step onto the top podium at a properly organised championship. Table tennis does, thanks to its reduced movement load: when travel distance is compressed, ball handling, spin reading and placement become the primary assets instead of foot speed.
I have watched a great many veterans matches across different associations, and the technical pattern always repeats. At forty, people still loop with power. At sixty, they shift to control. At seventy, they win with serves and by not making errors. That is a spectrum of technical transition that a medal table never records, but anyone who has sat through an O70 match recognises it immediately.
Six doubles golds and the list of recurring pairings
In doubles, England won six golds, and the list of pairings appearing in the report reveals a clear pattern of reusing pre-formed combinations.
The team pairings recorded include Ramage and Wilkinson in O40 men, Pilgrim and Griffin, Styles and Hurrell, Bowen and Tiplady in O70, and Seaholme and Balding in O75. These are players who travel together through multiple events, a sign of a small, trusted squad.
At veterans level, chemistry in a doubles pair often matters more than individual power. A left-hander paired with a right-hander covers each other's dead angles. A pair with one strong server and one strong third-ball player wins points in the short game. None of this appears in a medal table, but it is why fixed pairings usually beat ad-hoc combinations.
England's six doubles golds reflect a system that had already settled its pairings in advance, not a series of isolated individual flashes.
Cross-border pairings: the forgotten story
This is the most interesting part of the report, and also the most thinly handled.
Stephen Horsfield, an English player, won the O50 men's doubles with Colin Green, a Scottish player. Johnny Clarke, together with Scotland's Geoff Salter, took O75 men's doubles gold, in which Salter was the man who had just lost the singles final in the same age band to Seaholme.
Read those two lines carefully and a pattern emerges: the same Scottish player, Geoff Salter, lost a singles final to an English opponent, then a few hours later stood in a celebrating team with a different English player to beat the very opponent who had just beaten him.
It is a small detail that says a great deal about the Home Nations system. Associations in this group permit cross-border pairings. A Scottish player can partner an English player. An English player can win a title alongside a Scottish player.
And here the governance question arises that the report does not answer: which association is that doubles gold credited to? The report calls it an England gold, implying an attribution rule based on at least one member belonging to that association. But the original text does not state the clause.
When a doubles medal is claimed by two different associations at once, the number on the medal table stops being a single-valued fact.
This has a direct consequence on how the entire medal table should be read. If England's six doubles golds include pairings with a foreign element, then that figure of six is an aggregate number, not a pure one. It blends two different things: outright English victories and cross-association cooperative victories.
I am not saying the number is wrong. I am saying it has not been defined.
What the medal table obscures
There is a paradox in how this report is written. It devotes many lines to the seven-of-eight figure and very few to the four-of-nine figure.
Read only the headline and you would think England dominated comprehensively. Count each gold and you find England leads the rest by exactly one unit in the singles events. The gap between those two readings is precisely where data is distorted by presentational choice.
Numbers never lie, only the people reading them deceive themselves.
This is why I always advise readers of a medal table to ask three questions before believing it. One: how many events were staged? Two: how many of those were team-based and how many individual? Three: who decides how to count?
For this event, the first answer is more than seventeen gold events mentioned: eight team, nine singles, and at least six doubles. The second answer is that the distinction between team and individual changes the story entirely. The third answer is the host federation's media arm, meaning the party with the right to tell the story.
A medal table is a media product, not a raw dataset. Every time a federation publishes its own results, it is choosing the frame.
I am not implying deliberate bias. I am describing a natural mechanism: when you are the winning side, you tend to tell the story along the axis where you won most heavily. That axis here is the team events.
The data inventory: what exists and what is missing
We have gold medal results across three categories: team, singles and doubles. We have player names for most events. We have the list of participating associations.
We do not have the draw. We do not have individual game scores. We do not have serve statistics, rally point shares, or any technical index. There is no injury information. There is no information on who withdrew mid-event.
That is a larger gap than it appears. For a sports data analyst, an event with results but no process is an event that allows only the question "who won", never the question "why they won".
I could build a predictive model from this medal table if I also had data from previous editions. Without historical data, the seven-of-eight figure is a single pixel, not a trend line.
Data is the confession of those who once trusted their feelings.
The blind spot in technical content
A medal report is not at fault. Its job is to announce results, and it does that well.
But for an analyst, the absence of technical data creates a gap that cannot be filled by inference. Nobody knows what scoreline Ramage beat Horsfield by. Nobody knows in which game Salter lost to Seaholme. Nobody knows whether the team finals were close contests.
I could reason that at veterans level, a left-and-right-hand pairing holds an advantage, that serve quality and short placement decide more than power, that point-handling experience outweighs strength. All of that is true of veterans table tennis in general. But none of it is confirmed by the report.
Any tactical claim about this event, absent match data, is a guess written in a confident voice.
That is the point I want to make clearly, because many analyses fall into this trap. The writer takes a general pattern of the sport, wraps it in the context of a specific event, and presents it as though they had just reviewed the footage.
I have been wrong in that way many times, and I have learned that the only way not to repeat it is to say plainly: here, I do not know.
England's real opponents
Looking at the winners' list, the competitive picture emerges fairly clearly.
Wales is the most serious threat at individual level. Two Welsh players won two finals against two English players, in two different age bands, in two different genders. That is the pattern of a genuinely deep foundation, not of a lucky afternoon.
Scotland has Melissa Cheung as O50 women's singles champion, an O60 women's team title, and Geoff Salter as an O75 men's singles finalist. Scotland's results skew toward older bands and women's events.
Jersey, as host, has Mariusz Cieminski as O40 men's singles champion and Catherine Inverarity as O70 women's singles champion. Two golds at opposite ends of the age spectrum, on an island with a population under one hundred thousand.
Guernsey contributes Kay Chivers to the top of the O60 women's doubles.
The presence of Jersey and Guernsey on the gold list is a marker of a new participation wave in the Channel Islands, where population size is small but organisational density is high.
This is the point pure quantitative analysis misses. If you only count medals, Jersey and Guernsey are two small names at the bottom of the table. If you normalise by population, they are among the most efficient systems at the event.
I do not have exact population figures for these two associations at hand, so I will not fabricate a number. But the principle is clear: any medal comparison between entities of unequal size requires a denominator.
The points system and the real value of the event
One thing the report does not need to say deserves saying plainly: this event carries no WTT ranking points, does not automatically open a place at the world veterans championships, and offers no disclosed prize money.
Its value lies elsewhere. It is a milestone in the life cycle of a table tennis player. It is the reason a fifty-year-old keeps training three times a week. It is what gives local clubs a target ahead of them.
For the host federation, it is also a participation metric, and in many countries participation metrics are the condition for public funding.
The real value of a veterans event is not in the points table, but in the number of people who keep playing this sport for another ten years.
That is why I think reading this report through the lens of elite performance is the wrong direction. It is not a scaled-down elite event. It is an event that exists in parallel, with its own logic.
Veterans table tennis seen from Hanoi
I work in Vietnam, where the veterans table tennis movement is very strong but exists mainly as clubs, amateur tournaments and informal age groups. A formal age-band system like O40, O50, O60, O70, O75 at national association level is not common here.
That gap is worth thinking about. A formal age-band system does three things at once. It creates a competitive target for older players. It generates comparative data over time. And it turns long-term participation into a story that can be told to sponsors.
In the Home Nations model, a seventy-five-year-old still finding an opponent of matching standard in their own age band is the result of design, not luck. Bands that are too coarse leave the oldest group behind. Bands that are too fine leave each group too thin.
I have no data to say which model suits Vietnam, and I will not pretend otherwise. But I note this observation because it is why I read the Jersey report with more attention than a results release deserves.
What will shape the next cycle
Looking ahead, three signals are worth tracking.
The first is the health of the O40 band. It is the gateway to the entire veterans system. If the number of players entering this band falls over the next few editions, every band above it will thin out with a ten-year lag. Conversely, if the intake holds steady, the system stays healthy for decades.
The second is the frequency of cross-association pairings. If it was a one-off feature of this edition, it is an anecdote. If it repeats next time, it is a cultural shift: associations are actively mixing to raise competitiveness.
The third is the structure of singles finals. Four of nine is an open field. If that number rises to six or seven next time, it signals England is stretching the gap. If it stays the same or falls, the Home Nations system is holding its balance.
I will track all three, and I am recording my prediction now so I cannot revise it later: if the association structure does not change, seven of eight in team events will repeat, but four of nine in singles will not repeat upward.
Form is an illusion; only a sequence of numbers is a real current.
What the numbers cannot say
A medal table can tell you who won. It cannot tell you who sat in silence in the changing room after a semi-final. It cannot tell you how a Scottish player felt standing in a team photo with the man who had beaten him hours earlier. It cannot tell you how many sessions a seventy-year-old had to put in to keep reflexes quick enough for a final.
That is the residue of data, and for me it is usually the most readable part.
I once put my reputation on the line, and this sport answered with data. But it also taught me that matches are never only numbers. A player walking into a final at seventy-five carries forty years of training, early mornings, injuries, periods of quitting and coming back. No index measures that weight.
What I can say from the data is this: the event is operating exactly as a veterans system should. There are winners, there are losers, small associations have broken into the gold list, and the platform is broad enough that an O75 player still finds a worthy opponent.
What I cannot say from the data is whether anyone will be standing in their place ten years from now.
When the whole world shouts emotion, I choose to listen to the chart. But this chart has one axis I cannot draw, and that axis is the span of a human life.